After performing the tests with iSCSI and discussing the results with a friend of mine, I was a little disappointed as it seemed that the IX4 didn’t seem to perform as well as his system. Biggest difference between my IX4 and his NAS was the use of iSCSI on the IX4 and NFS on his. The next step might be clear, test the whole set again on NFS and so I did and I can already reveal that performance was much better now and is comparable to his NAS, which made me very happy again :-)
With the same ESX and VM configuration I reran my tests. The IX4-200D was still configured with a 2.7TB volume of which 1.5TB is configured for iSCSI, but the remaining 1.2TB is shared as NFS. I moved the test VM to this NFS volume and started iometer.
| NFS Test | |||||
| Test | Description | MB/sec | IOPS | Average IO response time | Maximum IO response time |
| Nfs 001a | Max Throughput 100% read | 108.5909 | 3474.908 | 17.22548 | 242.8462 |
| Nfs 001b | RealLife-60%Rand-65%Read | 0.879284 | 112.5484 | 537.8718 | 7263.568 |
| Nfs 001c | Max Throughput-50%Read | 21.38742 | 684.3974 | 87.72192 | 1764.932 |
| Nfs 001d | Random-8k-70%Read | 0.709705 | 90.84225 | 659.329 | 6771.195 |
For easy comparison find the previous iSCSI test below.
| iSCSI Test | |||||
| Test | Description | MB/sec | IOPS | Average IO response time | Maximum IO response time |
| Test 001a | Max Throughput 100% read | 55.058866 | 1761.883723 | 35.021015 | 207.740649 |
| Test 001b | RealLife-60%Rand-65%Read | 0.696917 | 89.205396 | 663.790422 | 11528.93203 |
| Test 001c | Max Throughput-50%Read | 22.040195 | 705.286232 | 83.689648 | 252.396324 |
| Test 001d | Random-8k-70%Read | 0.505056 | 64.647197 | 913.201061 | 12127.4405 |
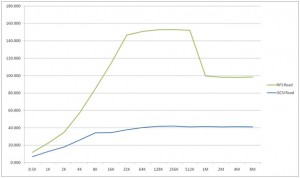
I was surprised to see so much difference in performance, I had expected some difference, but no difference as big as this. Looking at the data of the first “Super ATTO Clone pattern†test I ran, I can see the biggest difference between NFS and iSCSI being the short peak in read speed where iSCSI remained stable after reaching its peak performance at 41 MB/sec. NFS peaked to 110 MB/sec testing block sizes from 32K to 512K and dropped in speed to 57 MB/sec on blocks of 1M and larger.
Write speeds
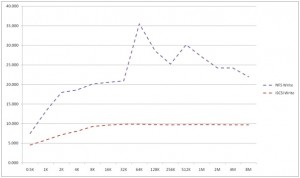
I noticed a strange result in the writing section. When enlarging the block sizes the write speed builds to around 11 MB/sec but suddenly spikes to 44MB/sec at 64K blocks and then drops back to 23 MB/sec at 128K and 10 MB/sec at 256K. To be sure this wasn’t a testing error I reran the test a number of times and compared the results. Below you see the table with performance results of the AVERAGE of 4 “Super ATTO Clone†tests for NFS, compared to one iSCSI test.
| iSCSI | NFS (average) | |||
| Block size | Read
MB/sec |
Write MB/sec | Read
MB/sec |
Write MB/sec |
| 0.5K | 6.950 | 4.540 | 4.931 | 2.931 |
| 1K | 12.770 | 5.824 | 9.736 | 7.332 |
| 2K | 17.858 | 7.154 | 16.756 | 10.844 |
| 4K | 25.980 | 8.080 | 31.162 | 10.508 |
| 8K | 34.296 | 9.247 | 50.480 | 10.865 |
| 16K | 34.410 | 9.652 | 79.811 | 10.870 |
| 32K | 37.686 | 9.828 | 108.821 | 11.102 |
| 64K | 40.271 | 9.840 | 110.614 | 25.669 |
| 128K | 41.862 | 9.712 | 110.800 | 18.909 |
| 256K | 41.918 | 9.689 | 110.985 | 15.503 |
| 512K | 41.011 | 9.725 | 110.976 | 20.432 |
| 1M | 41.443 | 9.713 | 58.147 | 17.315 |
| 2M | 41.093 | 9.719 | 57.042 | 14.480 |
| 4M | 41.241 | 9.703 | 56.709 | 14.537 |
| 8M | 41.006 | 9.687 | 57.477 | 12.273 |
Next is a graph that shows differences in read performance. See how NFS is much faster, even though there is a little drop at block sizes of 1M and more.
When comparing write performance (image below), you can see how NFS is at all points faster than iSCSI, but has a strange pattern above 32K.
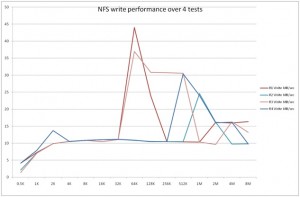
Trying to explain the strange results, I ran the same test 4 times, but each run gave different results compared to the other runs and I couldn’t come to one set of constant results, since there is always an unexplained peak somewhere in the larger block sizes. See the graph below in which 4 runs have been compared to each other.
As you can see in Run1 and Run3 I have a peak write performance at 64K block size that is very much out of band compared to Run2 and Run4 at 64K. Later on you see Run4 peeking to 30 MB/secat 512K blocks. I can’t explain why this happens. I’ve read through some NFS whitepapers to see if any saturation is normal for the protocol, but that isn’t the case. This “issue†should be related to my test lab somehow, but I can’t find the exact reason. I checked cpu of the IX4-200D during Run4 test, but cpu usage is well below 80% all of the time. In this run the %buffer that is close to 100% when writing 512K blocks, but that is where throughput is above the average 10MB/sec. If any NFS or storage expert out there can shed a light on this, I would be delighted to learn more about this.
Despite the strange results, I would recommend 64K block size as most optimal block size on NFS connected to the IX4-200D.
Reproducing the tests
To perform all these tests, I used iometer and a set of predefined tests. I have included them in the WinRAR file you can download Storage-Performance-Test.rar. For security reasons I had to rename the .rar file to .doc. So after downloading, please rename it to .rar. When you open the archive you’ll find the following files:
-         Histogram.xls: shows the differences between the iSCSI and NFS “Super ATTO†test.
-         Nfs-001-compare-block-ix4-cpu.xls: Shows the iostat data from the IX4-200D compared to the “Super ATTO “ performance data. Since iostat on the IX4 doesn’t produce any time stamps, there can be a small shift in time where I linked both data sets with each other.
-Â Â Â Â Â Â Â Â Â Super ATTO Clone Pattern.icf. This is an iometer config file containing the block sizes test. You can open it and use it to run the test with. Before starting check the settings explained belowd.
-Â Â Â Â Â Â Â Â Â vmware-community-test.icf. This configuration file performs the set of four tests that was also used in the vmware communities.
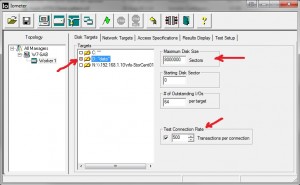
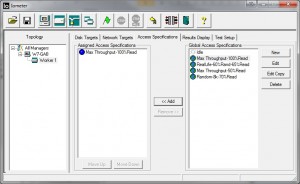
After starting iometer and loading a configuration set, make sure you also check these settings in the image below. The Maximum Disk size is set to 8,000,000 sectors. This will produce a 4GB test file on D-Drive. Make sure the test file is bigger than the amount of memory in the VM. Also set the “Test Connection Rate†to 500 transactions per second.
At the “Access Specifications†tab select the test(s) you want to run and then hit the green flag to start the tests. You can see live results at the “Results Display†tab.
Nice article, thanks for publishing it. I think I need to spend some money again and get myself an IX4 as well.
Great write up Gabe. When setting up my IX4, I decided to go with the 2.7 TB NFS DataStore. Moving my VMs from a Lefthand VSA (iSCSI) to the new IX4 NFS, I have been very happy with the performance. Nice to see the charts to back up the experience.
-Carlo
I want to ask a question – where in my enviroment should I set 64K block size? On VMware server, storage, VM partition?
Does anyone know if the IX4 runs NFS as a base file system and iSCSI is layered on top? Could explain the performance differences.
I want to ask a question – where in my enviroment should I set 64K block size? On VMware server, storage, VM partition?
Does anyone know if the IX4 runs NFS as a base file system and iSCSI is layered on top? Could explain the performance differences.
Thanks, it was very helpful post as far as I'm concern. I'm currently doing performance testing and using above information, I was able to test I/O characteristic in my lab. Though on physical box.
I have few question, I would be grateful if you can answer them.
1. What is the purpose of test connection Rate ? you have kept it 500
2. What should be the disk size? I'm using 32GB Ram server, and 60GB disk size. you have kept it 4GB
Thanks once again
Hi
I wasn't sure how to work with the test connection rate either. The manual says:
“The Test Connection Rate control specifies how often the selected worker(s) open and close their network connection. The default is off, meaning that the connection is opened at the beginning of the test and is not closed until the end of the test. If you turn this control on, you can specify a number of transactions to perform between opening and closing. (A transaction is an I/O request and the corresponding reply, if any; see the Reply field in the Edit Access Specification dialog for more information).
If Test Connection Rate is on, the worker opens its network connection at the beginning of the test. When the specified number of transactions has been performed, the connection is closed, and is re-opened again just before the next I/O. The number of transactions can be zero, in which case the worker just opens and closes the connection repeatedly.
Each open + transactions + close sequence is called a connection. The time from the initiation of the open to the completion of the corresponding close is recorded for each connection, and the maximum and average connection time and the average connections per second are reported.”
I did notice that changing this, does have an influence on the test. But since the test used in the VMware communities thread used the value of 500, I decided to use the same number.
2. The disk size doesn't matter that much. Just make sure the test file is more than the amount of RAM for the VM to rule out caching. So I used a 1GB RAM VM, 4 GB test file on a 50GB vmdk.
Gabrie
Thanks for your valuable comments and explaining my doubts. It really means a lot to me. I will be soon making recommendation to my internal team based on my findings. I give the credit to you for this….thanks once again
Thanks for your valuable comments and explaining my doubts. It really means a lot to me. I will be soon making recommendation to my internal team based on my findings. I give the credit to you for this….thanks once again
BTW, 8 years ago, Win7 was coming out right around then. With it and a 1Gb card, I was able to get Samba writes at about 125000kBytes/s and 119kB reads. timing between a linux server and a win7-x64 workstation. Number of cores didn’t (doesn’t) matter so much, as Win7 and samba (back then) could only handle 1 TCP connection for data transfer (vs. SMB3+ can use more than one TCP connection, but only on Win8 or higher).
I never tested iSCSI, but from what I gathered, there was no way it would be fast enough to
meet my needs for faster I/O. With a 10Gb connection between the workstation & server, I now
get network speeds along the lines of:
> bin/iotest
Using bs=16.0M, count=64, iosize=1.0G
R:1073741824 bytes (1.0GB) copied, 1.6722 s, 612MB/s
W:1073741824 bytes (1.0GB) copied, 3.66139 s, 280MB/s
—
It also uses ‘jumbo’ ethernet frames and tends to run cpu-bound on either client or
server depending on the blocksize (‘bs=’) param in dd.
In the above script, I focus on network speed, crating /dev/zero and /dev/null
in my test dir on the linux server. I used cygwin on windows to
run the bash test script.
From the performance figures I saw on devices offering iSCSI, I was rather underwhelmed
with the idea of using it for a transfer proto.
Most all of the off-the-shelf file servers had underwhelmingly poor perf (even w/1Gb ether speeds).
The only way I got satisfactory speed (~line speed w/1gbit, and cpu-limited on the 10Gb.
I could see the possibility of iSCSI exceeding a network-based file-transfer proto with
special boards that would plug into the bus of the server and client that offloads the
network transfer and presents the data to the hosts as a type of local-pci-based disk controller.
It’s really the smallish-network packet transfer sizes that dog performance in this area.
FWIW, I test network and disk separately, as testing them together is going to confuse
the issue. Only after you know best speeds for the components can you
see how using both together might make sense.