When creating NAT and firewall rules in a vCloud environment, not everything works out directly the way you had planned. This post will show you how to use Splunk to collect sys logs from the vCloud environment and make it an easy to use tool when performing some network troubleshooting.
Splunk comes in a number of flavours like Windows, OSX, Linux. In my environment I have a RedHat based NFS server that is doing almost nothing and will now be promoted to be my Splunk syslog server. Start by downloading the free Splunk version from www.splunk.com. You’ll need to create an account and then go to the Linux RPM (because it is RedHat). My RedHat server is without GUI, so I first tried the download link in a wget command, but that didn’t work since there are some scripts behind the download link. I was very pleasantly surprised though that the Splunk website offers a special wget link. Excellent! After downloading the RPM you can simply install it with “rpm -i <download rpm>”. Open the webpage of your Splunk server at port 8000 and walk through the brief configuration wizard.
To add sys logging as a service (called an App in Splunk), go to: App -> Home (upper right corner). Click “Add Data” and choose “syslog” from the list, then select “consume syslog over UDP”. In the next screen enter UDP port 514, leave “Source name override” blank and select source type “syslog” from the list, click SAVE. Your syslog server is ready to receive data.
Enabling syslogging in vCloud Director
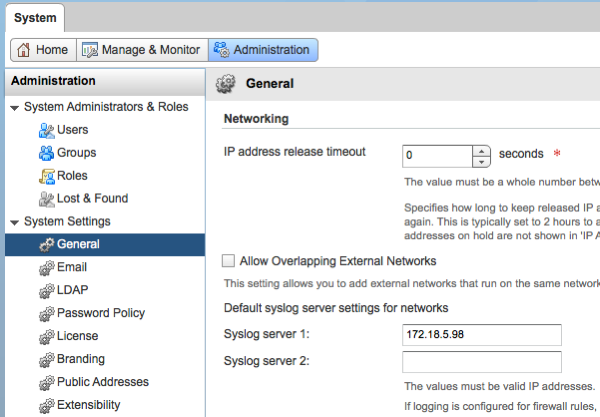
In the vCloud interface make sure the loggings are sent to the syslog server. To set the IP address of the syslog server go to the system tab in vCloud Director, select Administration, General and in the networking section you can now enter the IP address of the syslog server. Press apply to save.
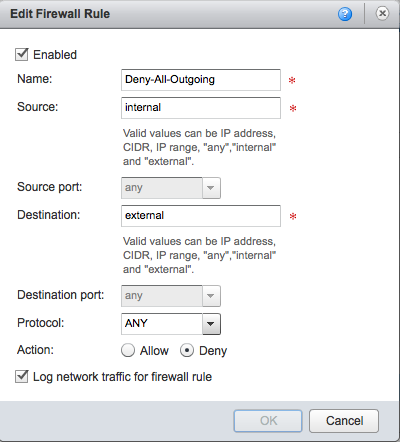
When building firewall rules you can choose to log traffic per rule. This is very handy to exclude a lot of traffic of rules that already work fine. When creating a new rule I would advise to enable logging for that rule and (for a short time) also enable logging for the bottom rule, which is usually the rule that denies everything. By enabling logging on this last rule you can see that packets that don’t meet any of the previous rules are dropped. This often helps you understand why those packets are dropped.
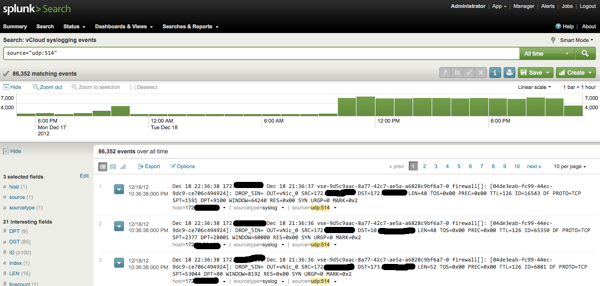
After sys logging is enabled in vCloud Director and you have enabled logging at the firewall level, it is now time to show how Splunk can help you troubleshoot.
Find the syslog data
The first time it took me quite some time to find the correct view / report and I still have to try a few times before I get the right report, but luckily you can save a search once you found the correct one and access it very quickly. Open the Splunk web interface again and select “Manager” in the upper right corner. Here you’ll see a page with lots of options, choose “Searches and reports”. At the top of this page, select “All” for the App Context. In the list below find the item “Messages by minute last 3 hours” and select “Run” at the end of the item. A new view will open and you can now see a lot of matching events in a graph. At the top of the page select “Dashboards & Views” and “Summary”. And finally, there is the “UDP:514” option we need, Click it. A new page will open and show you the latest events coming from your Edge firewall. To make it easier the next time you want to access this report, press the “SAVE” button and give this report a name. Now you can easily access this report from “Manager” – “Searches and Reports”.
Troubleshooting
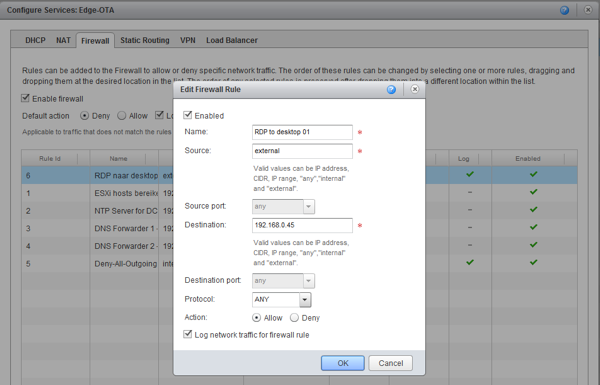
After setting up Splunk, configuring vCloud Director and finding were the reports are hidden, we can now finally do some troubleshooting. I have created a number of firewall rules which are working nicely and I’m just about to add a new rule that I want to test: RDP to desktop1 with a Source address that is external and a destination of 192.168.0.45. See how I enabled logging for this rule. Also notice the last rule in the background on which I also enabled logging.
After the rule is created, go to the Splunk interface and open the syslog search page and generate some traffic that should be handled by the newly created rule. For this example I created a rule that I know isn’t going to work, just for demonstration purpose. Hit refresh and you can now see on the search page that traffic has been captured, showing you the packets were dropped. Notice the text: “DROP_131073”. This is a clear clue on WHY the packets were dropped.
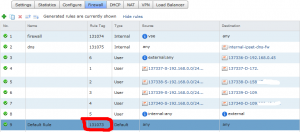
To understand the 131073, you will have to open the vShield Manager in your vCloud Environment. After logon to the vShield manager web interface select the “Edges” view, then select “Edge Gateways”, in the middle pane select your Edge device and click “Actions” – “Manage” – “Firewall”. In this view you can see the firewall rules that are generated automatically by the Edge device and your manually created rules. Note that the “Rule Tag” number is equal to the number you see in the vCloud interface. In this case the DROP_131073 tells us that the packets were dropped because of the default any/any rule which denies all traffic. (Click on the image to enlarge)
Not only the DROP message is important. To understand why your traffic is blocked and try to create a working rule, you’ll also need to check:
| SRC | Source IP address |
| DST | Destination IP address |
| PROTO | Protocol (TCP, UDP, IGMP) |
| SPT | Source Port |
| DPT | Destination Port |
If you look at the syslog and now understand why your rule failed, you can easily edit the rule and check if it is working now. What you’re hoping for is of course the “ACCEPT” message in the logs. In my case it shows “ACCEPT_6” because custom rule number 6 was the match to accept these packets:
When you’re done troubleshooting, don’t forget to disable logging on the rules where it is no longer needed. Have fun !!!


Hi Gabrie, nice post, glad the suggestion for Splunk was useful at the end!
I would also like to point out the importance of clicking the option “Synchronize syslog server settings” after configuring syslog in the General settings under “Administration” for the System organization. Otherwise, the syslog settings from System will not apply on the network you are trying to log from. We just ran into it and spent ~30 minutes wondering why we never got any logs. Thanks for a good post!